How to Make visual End-year Review presentation
The last quarter is the time to prepare a summary of the company’s yearly performance. Answering whether the yearly objectives are valid and whether the sale quotas were done. And looking slowly into next year’s plans.
If you are involved in preparing such a business review presentation, here are a few suggestions on how you can make the review visually engaging.
How to show financial results, sales or production quotas, and other KPIs in eye-catching form.
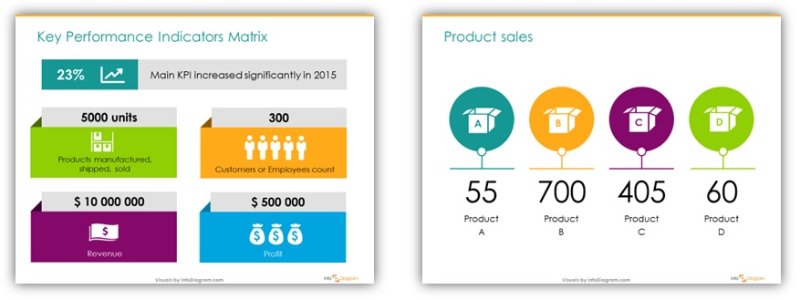
Make key data visualization attractive
Presenting pure numbers can be attractive for the presenter who knows the story behind, it but less engaging for your staff. Especially if you have a whole bunch of data slides to show. Your audience can suffer a famous death by PowerPoint 🙂. Fight it with good story-telling and professional design of your presentation.
Make your presentation more visually engaging. Add a few simple shapes – and change plain numbers to colorful, simple infographics:
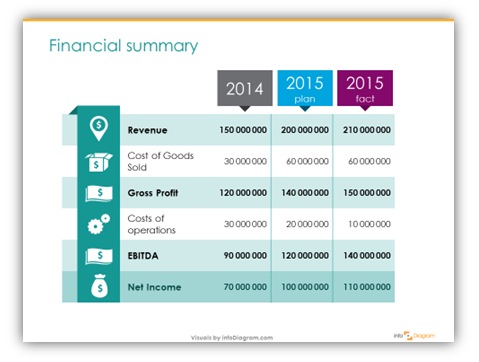
Enhance financial tables
For accounting topics – enrich your finances data tables with icons for revenue, profit, and costs. Make visual column titles by adding a simple rectangle with text, or adding illustrations for table rows, in case you have a place for an icon:
In case your tables are too dense to add any new graphics there, at least take care the cell margins are properly set – numbers are not too close to table borders. Consider removing table borders at all. This will improve the readability of your financial slides a lot.
Showing a year event timeline
If you are presenting a history of this year’s campaigns or projects, show it on a graphical timeline:
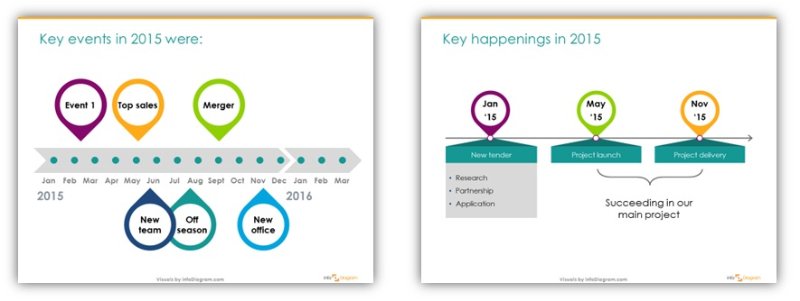
Using shapes instead of plain text to illustrate events makes such a timeline visually more attractive.
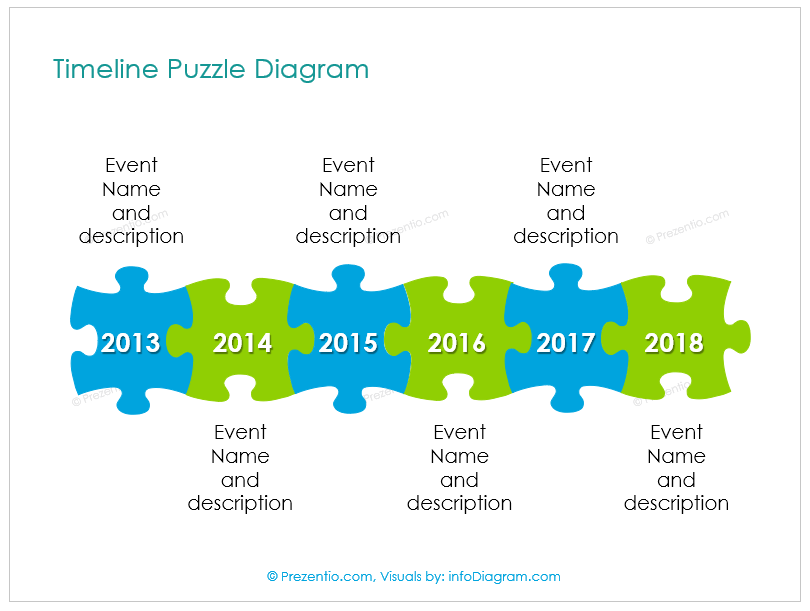
You can create a timeline from puzzle shapes (read my article how to design such jigsaw puzzle yourself in PowerPoint).
Making sure your message comes through
Finishing the presentation, make sure you will summarize what was done well and what can be improved. So your team is motivated to work on new challenges.

See a few tips on how you can make visually this message stand out on my LinkedIn post.
More examples of how you can make your Annual Review presentations good-looking are on my Slideshare:
A quick survey
I wonder which of the slides above are the most frequently used by you? Financial report? Key data slide? Timeline?
Enjoy your end-year parties.
PS. Need help with your end-year presentation? I will gladly help with slide design – contact me here.
1 thought on “How to Make visual End-year Review presentation”
Comments are closed.