Overcrowded Presentation Slide? Power of Structure in Slideuments
A question we get often during a slide design training is how to present a slide with lots of data in it. Let me share several tricks and examples what you can do in such situations.
In theory, the best is to split such a slide into several separate slides. This will give you more space. However, what if you have to show all content on one slide? This is the case when the slide is to be read on a screen, send as report material, and not presented live. The way to keep such dense content presentation still readable is to work with structure and use layout properly.
There is a special name for slide format that intentionally contains lots of data – a “slide-document “ in short “slideument” or “slidedoc”.
Slideument is a type of presentation that is expected to be read, not presented live. Typically it contains several blocks of text and looks more like a leaflet.
Designing such a slideument slide, you should approach it as designing a text page infographics. Create layout with several columns, organize elements inside a grid.
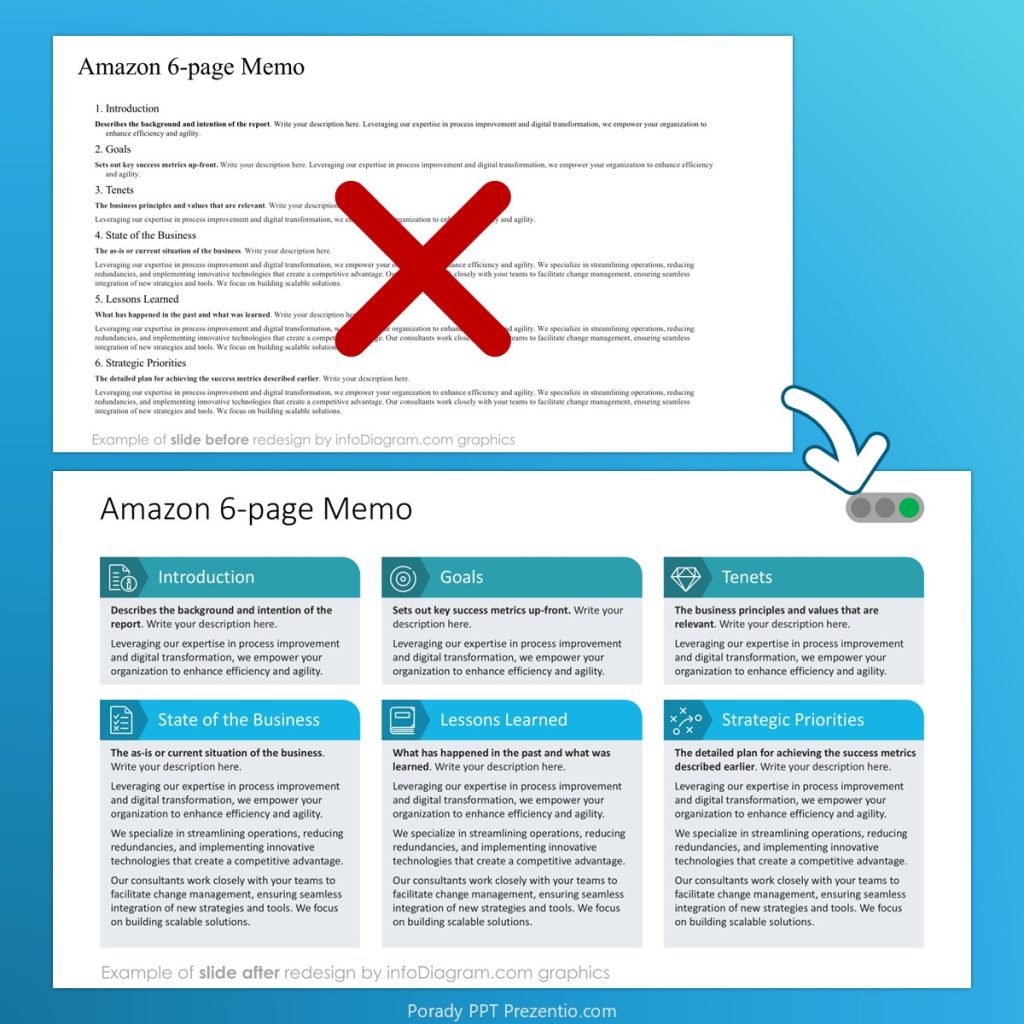
If you have a space next to the block headers, add there small icons illustrating the block topic. It will help a reader to recognize specific slide parts. You can use various colors for the header blocks, to underline content structure and highlight the key elements.
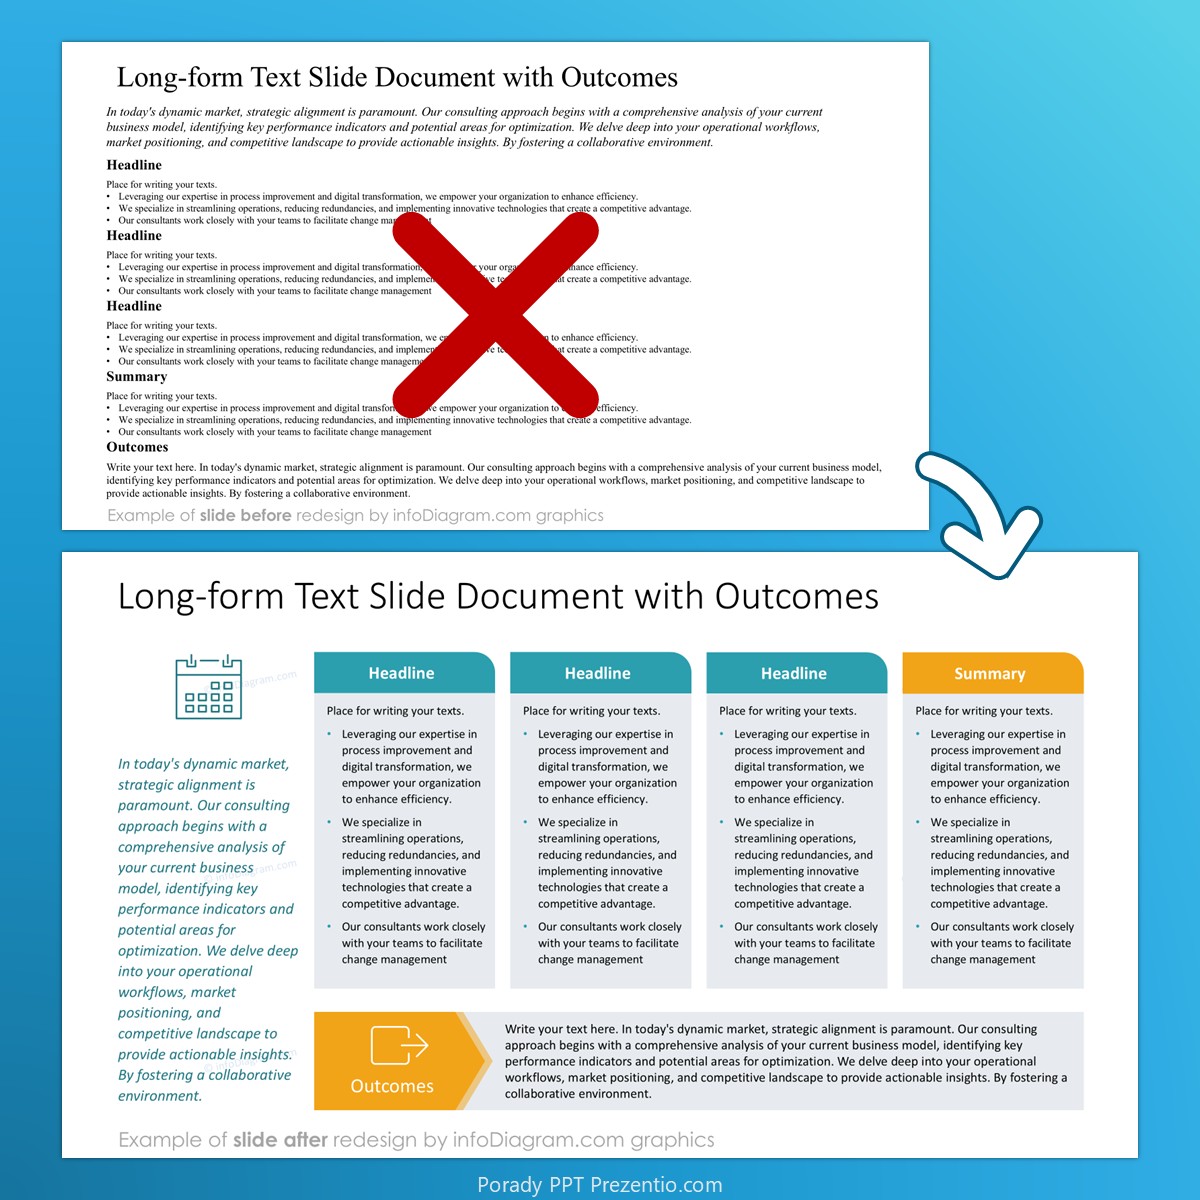
See our example of how you can transform a plain text slide to a more visual one containing text blocks.
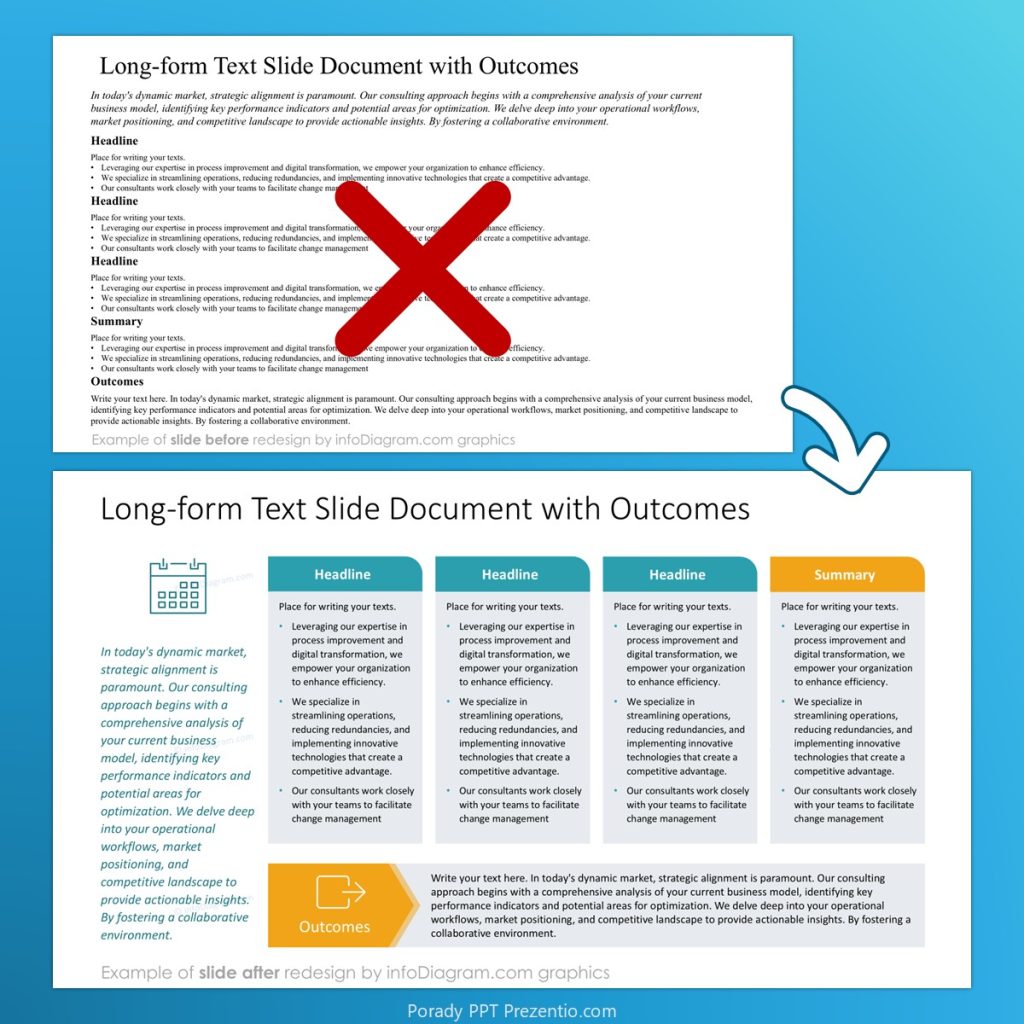
And here’s another example of a slide designed in PowerPoint with columns and highlighted summary and outcomes element:
It’s important to show a clear visual structure when working with such overcrowded slides. What can help you:
- the design tools for alignment, distribution, and grid. You can find them in MS PowerPoint under Shape Format tab in the top menu. If you are not familiar with them, take some time for exploring how they work.
- a bit of design principles about ways of creating a visual contrast and visual hierarchy.
Learn more about graphic design principles and advanced PowerPoint tools – join our online training Making Visuals Slides.
One-pager slide example
Another similar type of slide with dense content is one-pager presentation. Such presentation attempts to fit all content inside a single slide. Here are some examples of such slides:
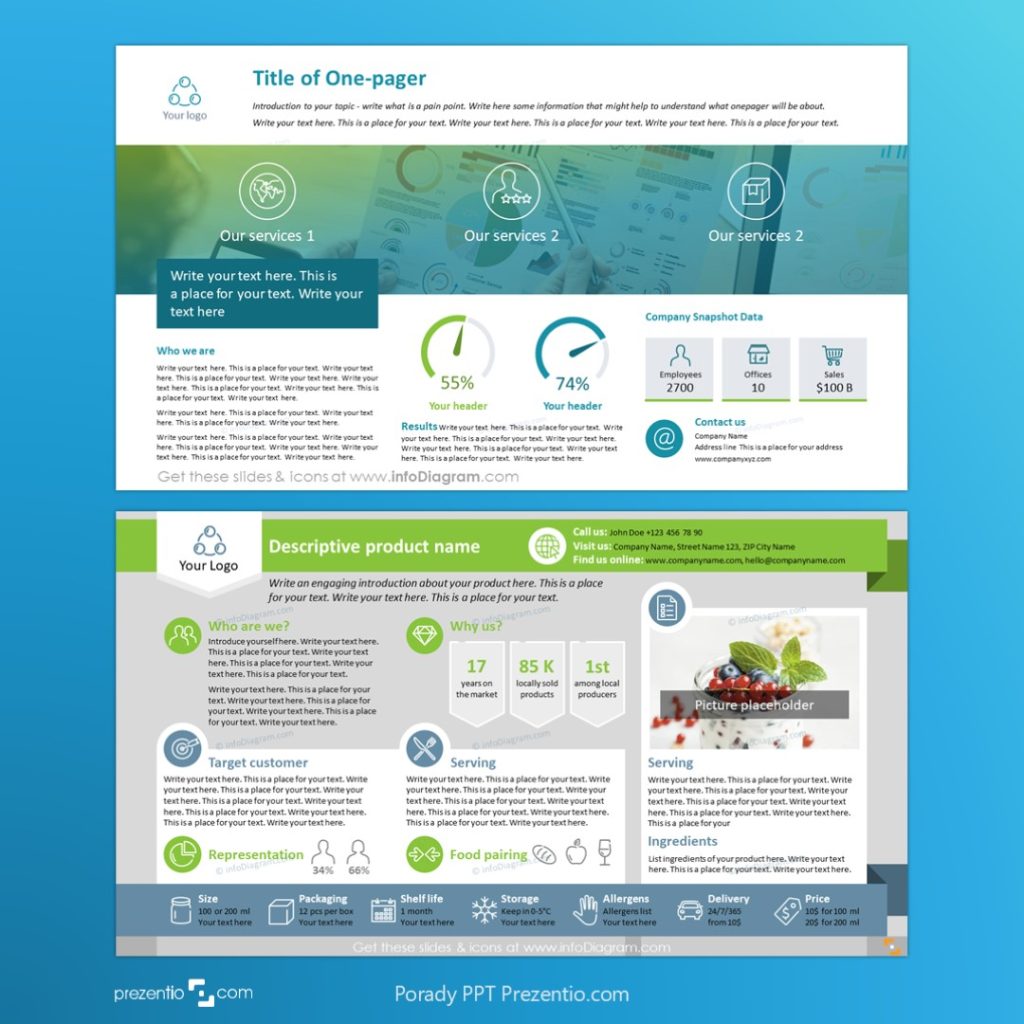
Notice that here we are using the full slide space for some elements, including the margins area. However, the content itself still remains inside the margin area.
You can explore more one-pager layouts in our slide library infoDiagram.com – search for “one-pager” or “dense slides” design.
Power of structure for Slide-ument or One-pager slides
To keep such dense slides readable, create a graphical structure that is easy to follow. A reader should know at first glance which element is the first to look at. And then, where to move on, and where is the final step. Having well-aligned content helps a lot.
Use those three rules coming from generic graphical design theory:
Master Alignment and Distribution
In professional desktop publishing (DTP), the concept of using an invisible grid is one of the key tools. On a one-pager slide, you can create such a grid yourself, using PowerPoint’s guide lines, for example.
Alignment means ensuring all text boxes, images, and shapes snap to the same baseline or vertical axis.
And distribution means having regular spacing between your content blocks (this can be on several levels, in main blocks and in the subblocks, as you can see in three ribbons or three company data feature boxes on slides above).
Establish a Clear Visual Hierarchy
Imagine your slide is like a professional magazine page where the eye is guided to the most crucial information first. Create a visual hierarchy through scale and contrast. This means defining distinct sizes for your titles, headings, body text and other graphical elements.
To highlight the most important content – some key metric or critical takeaway – use a visual cue. A good method for dense slides is applying a subtle, contrasting background color to a specific content block – see use of background colors in slides above. This acts as a spotlight, immediately drawing the reader’s attention and communicating the block’s importance without needing to use large text. Avoid bright or primary colors for these background blocks, as they can interfere with legibility.
Utilize Graphics as Functional Complements
Graphics should function as powerful aids, not merely decorations. Enhance the overall aesthetic appeal of the slide by using high-quality visual elements that are stylistically consistent (e.g. using only outline icons or a photography in one style).
Small graphic elements, such as icon symbols, must act as complements to the content. Place them next to headings or key bullet points to act as visual anchors or memory hooks that help the reader quickly categorize associated text. The icons should be small and subtly colored to support the words without dominating the primary text. Remember, they are meant to assist.
By treating your one-pager slide as a formal document governed by professional DTP rules, you ensure its clarity and impact.
For more tips and practice of making quickly visual slides, check calendar of upcoming presentation design training courses. I teach there graphical design essentials and their application to business data visualization.
Peter,
Trainer and Presentation Designer, founder of Prezentio design agency
PS. Follow or connect with me on LinkedIn, I share there weekly some slide visualization examples. Or join my occasional PPT Inspirations newsletter.