Planning 2026 activities: How to make readable business calendar table in PowerPoint
Does your plans for 2026 sit inside white & grey Excel table, that people easily overlook? Let me help you plan this year activities with visual impact.
I am sharing a few simple tricks to use PowerPoint and transform calendar tables to attractive and readable . See our examples of colorful calendar tables that you can use to plan 2026 activities.
Such a creative calendar can not only impress your colleagues but it can help you organize better work of your team, thanks to planning clarity.
What are pros and cons of calendars in Excel vs PowerPoint?
Calendars for personal planning: Most common use of calendars I see around are in paper form (any kind of diary book) or some mobile app (Google or Outlook Calendar seems to be most common).
Calendars for team work use and planning: Considering a dedicated calendar apps, I see a lot Microsoft Outlook or Teams calendar apps, in case you are working in MS Office environment. Or Google Calendar if you are in Google systems.
Calendars for presenting to a team: If you want to share calendar on a meeting, or have flexibility to add details and adjustments, then people are using classical table format made in MS Excel (or Google Sheets). While such Excel tables are good way to quickly create a roadmap table or overview calendar, it usually lacks visual creativity and flexibility that a table made in visual tool like PowerPoint offers.
Excel calendars pros & cons:
- good if you have data-driven content – numbers inside cells that are calculated with formulas
- easier to fill with sequential content (e.g. you just drag the a cell with number and it will create next cell with incremental value)
- harder to add graphical elements besides cell fill and grid color. For example, if you add an icon inside a cell and then resize a column, the icon will get stretched.
PowerPoint calendars pros & cons:
- more fit for longer text content. As you can add a margin inside the cell, format better the text than in Excel
- better for creative look e.g. for adding graphical elements such as icons, stripes
- easier to adjust, move around as separate object
- harder to fill automatically (from formula or sequential content). There are ways to do it using some advanced tools (check our AI & PowerPoint design workshop).
If you work in corporate enviromnent, probably you use PowerPoint anyway for presentations. But MS PowerPoint can be a tool not only for presenting purposes. It can be your teamwork control dashboard, where you can report your team results and plans for next months.
The key features PPT offers is visual clarity and flexibility. Even the most precise financial data or schedules are not working, if they are unreadable. Therefore if you want to keep attention to your plans, consider replacing data-heavy Excel tables that people copy directly from Excel. Get inspired by my examples how a calendar table can look like, when made in PowerPoint.
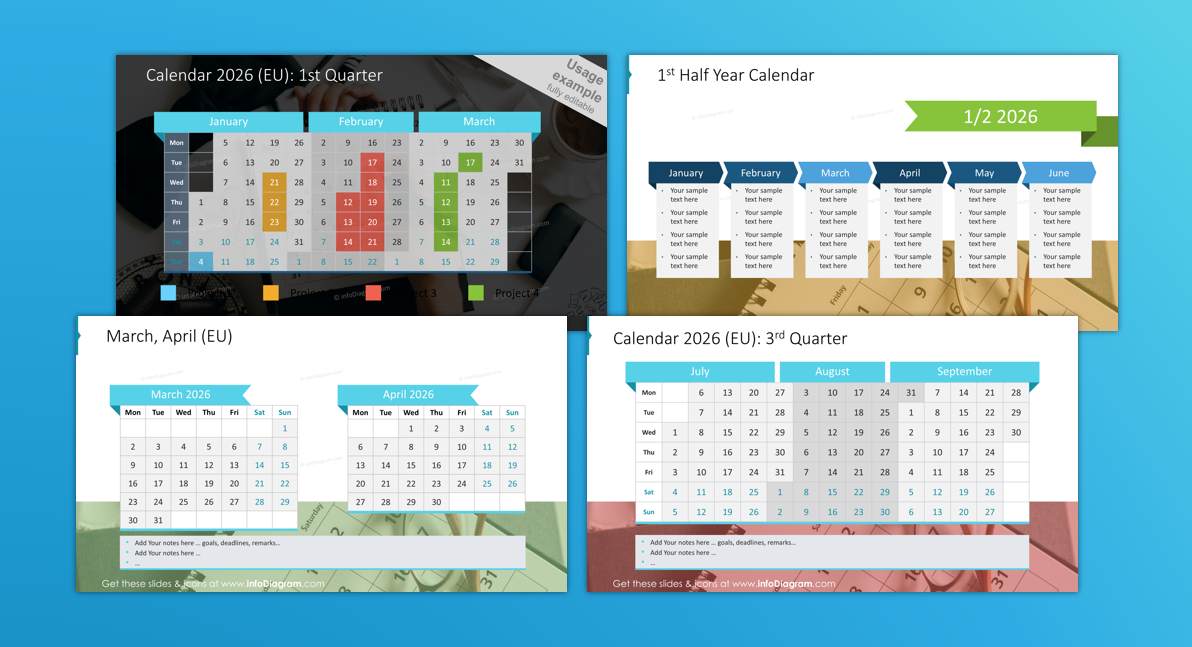
Quarterly Calendar Table Design Enhancement in PowerPoint
To present a big picture of events for group of people, a calendar presented as a slide on big screen is more handy. Here are a few tips on making attractive calendar tables:
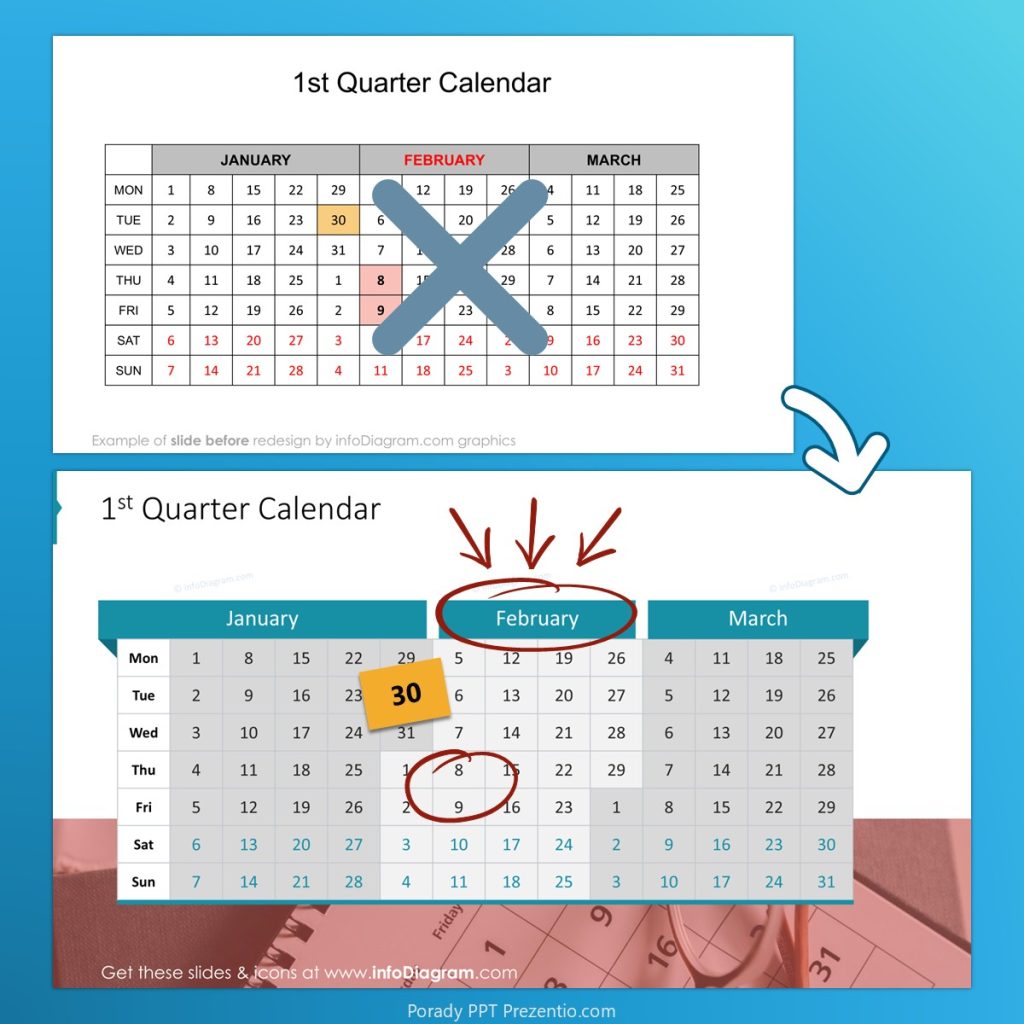
- Highlight the important dates. Make them stand out. The quickest way is probably making text Bold (with shortcut Ctrl+B) or changing its color. However, you can be more creative and use hand-drawn shapes to draw attention to a specific date and give your presentation a personal touch.
- Add a customized header for names of months, or other periods, or for some key message.
- Illustrate key events by post-it-like note cards placed over a calendar. This will create a friendly, informal look for your presentation.
Check out more ways you can redesign a calendar in my blog article: 5 Tips on Designing Professional Calendar Table in PowerPoint
How to visually present activities for next 3 month? DIY 30-60-90 plan
30-60-90 is a popular framework for presenting your plans for the upcoming months. It is often used in new job application process or when you’re launching a new project. The goal is to present key activities and outcomes during the first, second and third month. There is also 30-60-90-120 version if you want to present longer period – for the next 4 months.
See our design ideas for creating such 30-60-90 presentation plan.
If you want to present in your plan a structured information e.g. not only list of task itself, but also its deadline, responsible and cost, then we suggest using a tabular form as your base.
Example of 30-60-90 slide makeover in PowerPoint
See how we redesigned a source slide with default table. Adding a few typography changes and graphical elements can transform your planning table into more eye-catchy slide:
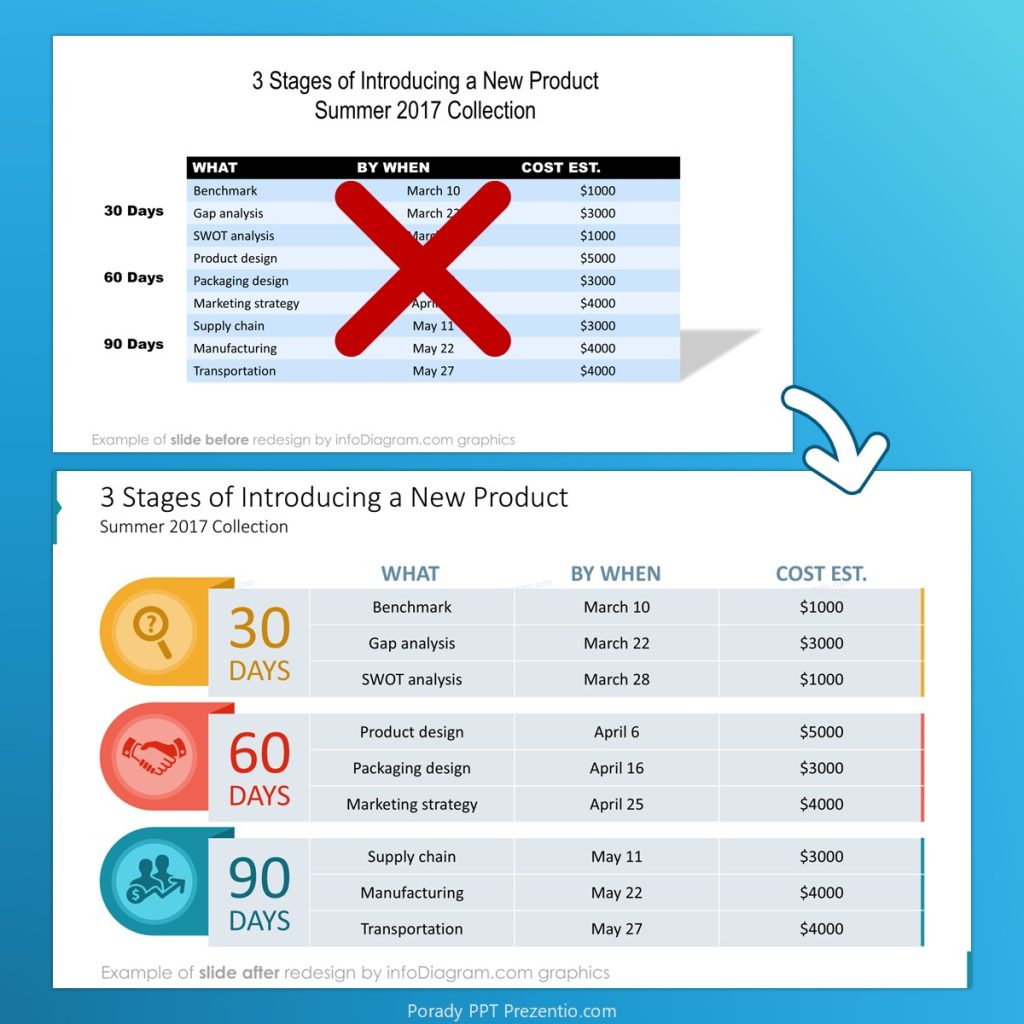
You can work with cell colors – assigning specific color for each period. See how you can frame the period with adding vertical border to the table for the specific period. Adding a custom shape and icon helps also to grab attention for given period. Notice also improved readability thanks to adding internal margins and less aggressive header row.
Do you know how to add custom color grid to a PowerPoint table? When editing PPT table – there is a separate tab that offers editing tools. They may not be very intuitive, as this component uses a bit different interface than shape editing tab. For example you need to first select a color before applying it to the table grid.
Want to learn how to effectively create or edit table look in PowerPoint (or in MS Excel)? Join our online workshop on Data Visualization in PowerPoint or Advanced PPT Slide Design . We show there a bunch of design tricks and do interactive table editing exercises.
OKR Plan Table Slide Makeover Example
Another planning framework we work with often in slide design is OKR (Objectives and Key Results) methodology. OKR approach defines for each Objective a specific measurable Key Results.
Here are two examples of visually enhanced slides presenting time distribution and status for a specific OKR goal. Notice how we presented a table – adding different color coding for rows, for time period columns. You can also add a symbols representing headers – as we did in our example.
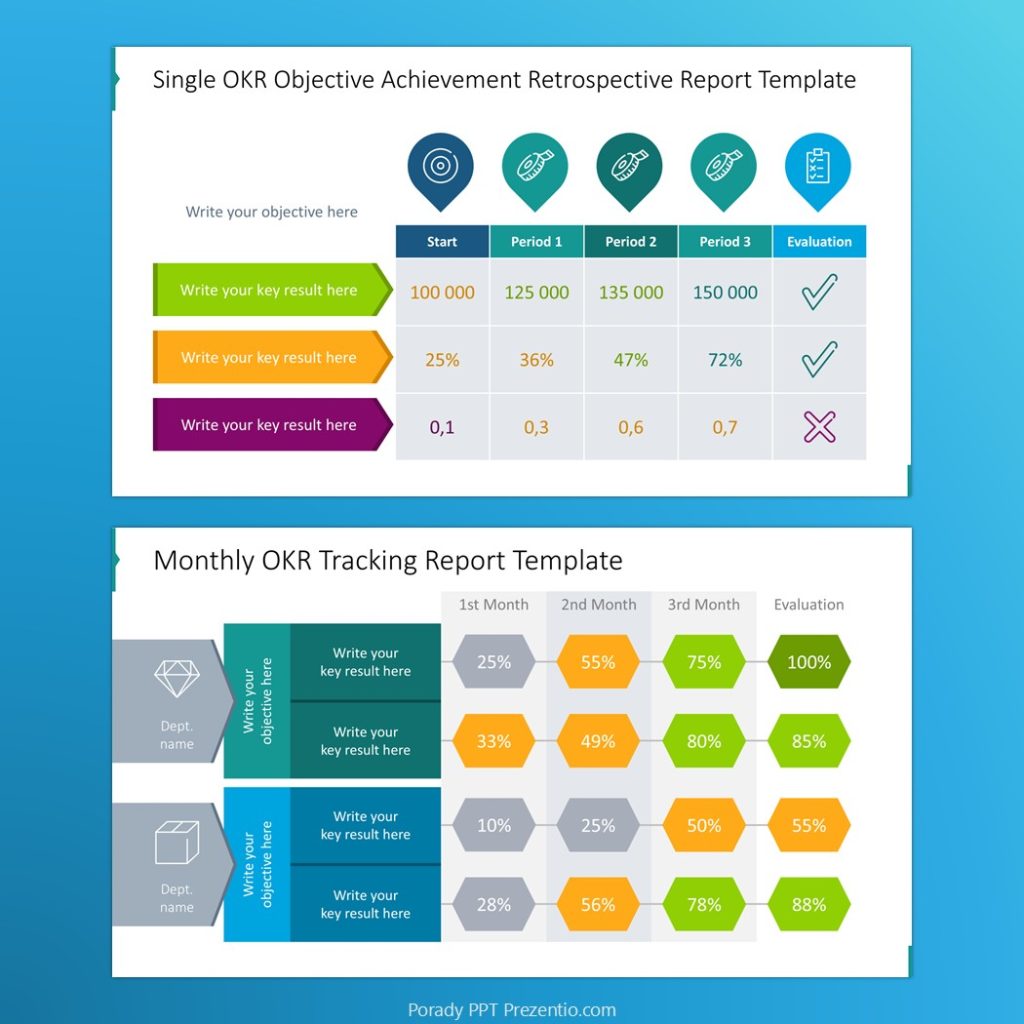
Or you can use custom shapes to express OKR advancement tracking, as you can see in the slide example above.
Alternative way to present 3-month plan without using table
A table is not always the best visualization format. For example, in case you don’t have structured information about your plan, but only a set of loose text descriptions.
In such situations, you can work with typography and the placement of text boxes on a slide to achieve a readable layout. You don’t need to search for complex visualization. It’s enough to work with white space and location of elements.
See our redesign of slide that presents plan of setting a company. We only unified the text blocks and added the appropriate icons expressing the growth stages of a company.
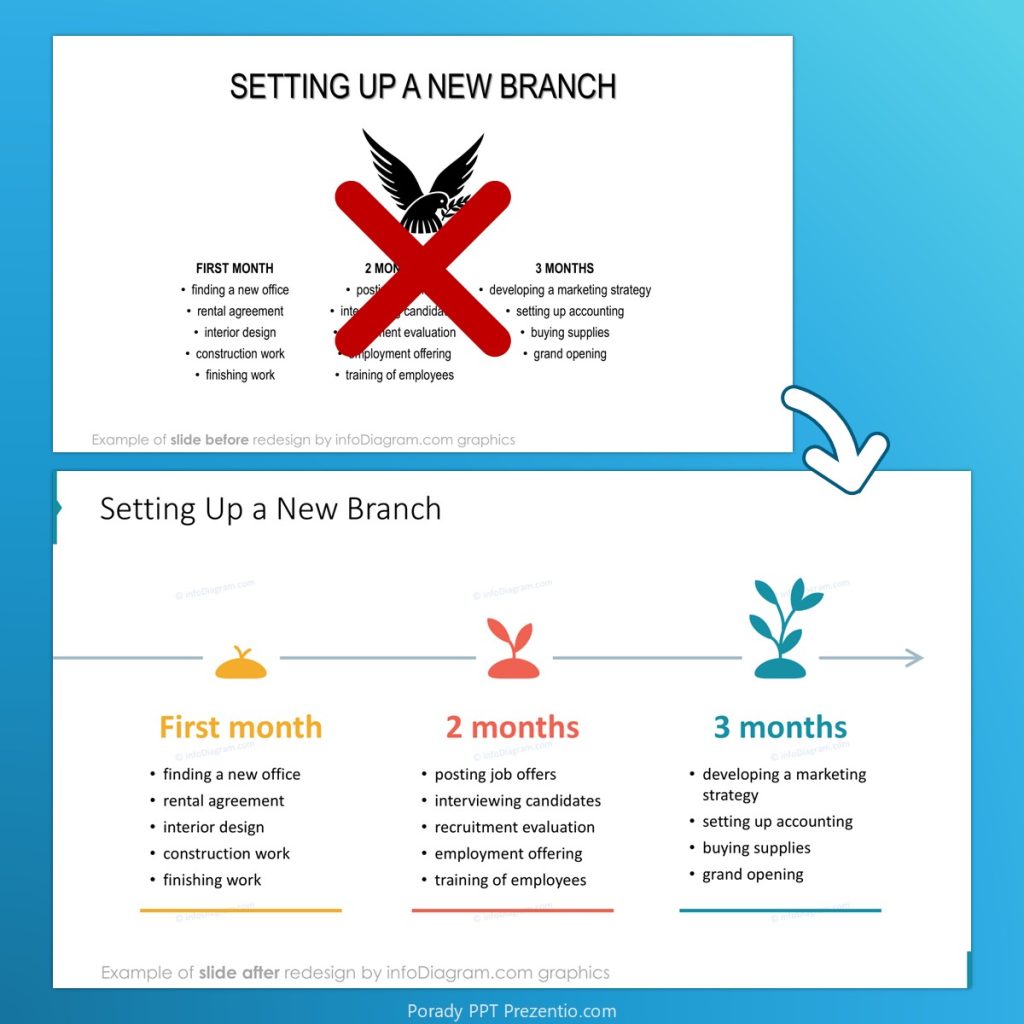
Notice how the text is more readable when align bullet-points to the left. The slide before redesign contained bullet points aligned centrally – this is a common visualization mistake. Such central text is harder to read as each point starts at different location.
Best way to work with Calendar Tables in PowerPoint
How to insert a 2026 calendar from Excel table into a PowerPoint deck
If you have already a calendar table e.g. from Excel, you simply can copy it to PowerPoint. But keep the format of the table (not as embedded Excel table, if you don’t need formulas, not as bitmap picture, that you can’t edit).
If the look of the copied table changed – it’s probably because your destination PowerPoint uses different color palette than source Excel. You can choose which colors to use in Paste Special options.
How to customize the calendar table using PowerPoint tools
After you copy the calendar to MS PowerPoint as a table object, it’s worth to customize it a bit, to be more readable and attractive. What I usually do when facelifting a table:
- Unify font inside the table: use one or two fonts
- Make content visible: I try to underline the visual hierarchy of information in a table. I recommend to use stronger cell color to highlight key dates. And separate header rows or columns in a subtle way e.g. by using grey background there.
Take-away: Attractive design is not about aesthetics, but your work effectivity
As a presentation designer I work with calendar tables quite often. Clients give us tables with product roadmaps or marketing activities. And over my career I saw often how bad design results in miscommunication and hours of lost work.
In business presentations clear information is a key. However, the way you present this information will decide how fast your recommendation will be accepted. That is true also for using calendars for planning. Easy to follow calendar tables shorten the understanding time by your audience.
When your planning slides will look well-organized, also you as a presented will be seen as organized person, who cares about details. Presenting readable plans builds your credibility. And visual highlight of key dates and events will ensure your team won’t miss an important deadline.
Use our calendar table design tips to make sure your ideas won’t be lost somewhere inside overloaded dense table.
Where get premium 2026 calendar PowerPoint templates online?
Here are sources of calendars slides
- Excel calendar tables present in default MS Office that you can customize further
- PPT stock webpages with PowerPoint templates for example infoDiagram slides library.
- There you can find two sets of calendars with 60+ editable tables for specific months of the year, quarters, and creative graphics for showing deadlines.
- US format 2026 Calendar PPT Template (with Sunday as 1st day of the week)
- European or ISO format 2026 Calendar PPT Template (Monday as 1st day of the week)
- There you can find two sets of calendars with 60+ editable tables for specific months of the year, quarters, and creative graphics for showing deadlines.
Good luck with planning your 2026.
Peter
Your Presentation Designer and Diagram Magician
PS. For more presentation tips and examples, follow Peter on LinkedIn or join my newsletter “PPT Inspirations”, where I share free presentation graphics and tricks.