

Designing readable and interesting data charts is another practical topic of our Academy of Visual Communication.
You will meet with data charts not only in PowerPoint, but in Excel sheets or other software.
The tips I am sharing below include generic data visualization rules that you can apply for whatever tool you will use.
Go through those short videos to learn about data visualizations and see examples of data chart visual enhancements – done mostly with PowerPoint only.
1. Spotting Data Chart Mistakes
What are common PowerPoint chart mistakes? See an example so you can avoid it.
2. Quick Improving Chart with PowerPoint tools
Let me present a trick how you can quickly facelift data chart without much design work.
3. Customizing MS Office Data Charts
Office data charts has several options you can tweak to make them look better. Default chart not always use the best setting. On the video below I show what chart option is worth to change.
4. Enhancing Data Charts graphically
And here I share a way to enhance charts with adding some new graphics, to make them look visually more attractive.
Practice yourself
The best way to learn creating attractive data charts is by doing.
We have set of exercises you can try at home or within our online training. Explore learning options within our Visual Academy.
Examples of data chart makeovers
Check my example of highlighting outliers in bar chart using PowerPoint shapes:
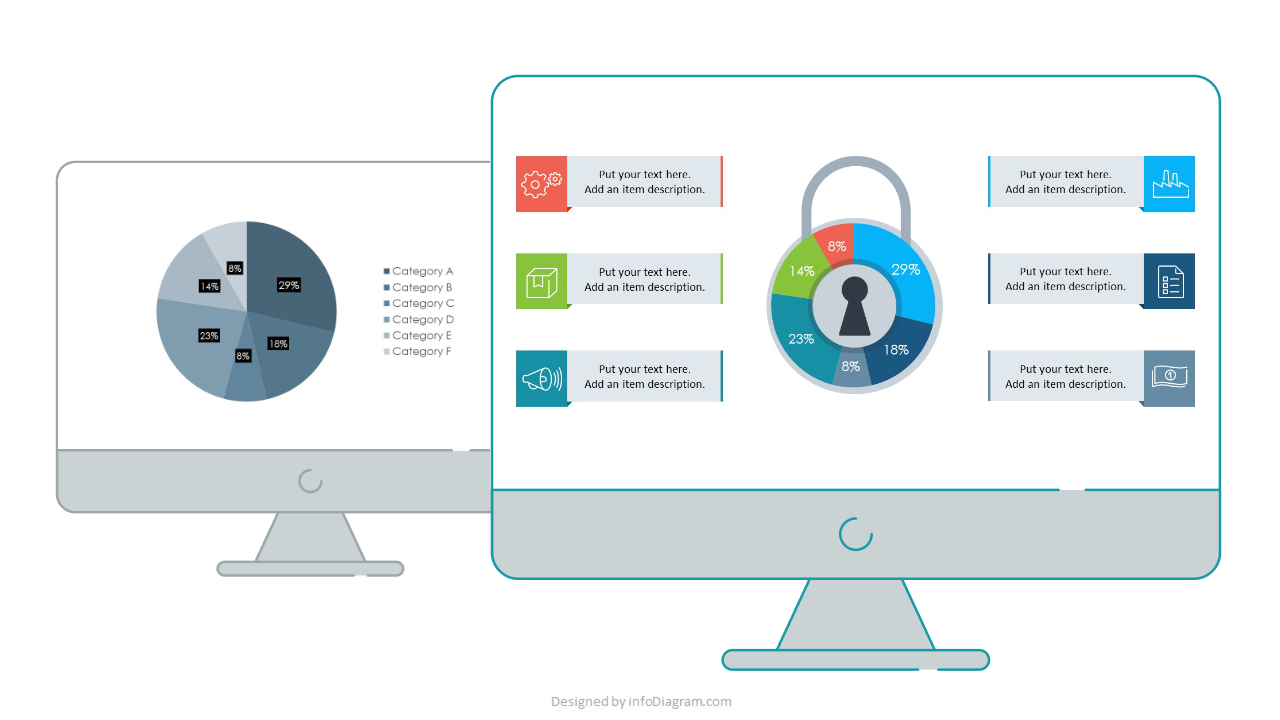
Another example shows how you can makeover of dashboard slide with data charts:
Example of financial dashboard presentation – visualizing KPI data:
Summary: Check-points for Data Chart Visualizations
Whatever data chart you have, apply this check to ensure your data chart is good enough to present.
- Do you introduce context clearly? What’s the title of data chart? Are all data categories described, is there a easy to read legend?
- Are you using a proper data chart type? The most universal are bar charts. Line charts are usually only for time-related categories. Pie charts look cool but they are not suitable if you have over 6 categories to show.
- Is the main outcome of the chart visible enough? Highlight the most important data or outcome message. Use colors and / or location on a slide for that.
I hope those inspirations get you started on creating data charts that will impress your audience.
Get more practice – with our supervision, consider joining our Slide design Masterclass training or coaching.